The Equibase Economic Indicators in Thoroughbred Racing report for July revealed another year-over-year increase in wagering, with horseplayers putting down more than $1 billion during the month. That reflects a 16.6% increase over July 2019’s numbers.

This increase happened because more tracks opened up during July, most notably Saratoga and Del Mar midway through the month. Belmont Park’s healthy handle, which led all US racetracks in June, segued neatly into Saratoga’s summer season. In turn, Saratoga bettered its 2019 opening weekend all-sources handle by 9.4%
Del Mar, meanwhile, drafted lightly off small Los Alamitos’ two-week Thoroughbred season. It also endured a canceled weekend of races due to a coronavirus outbreak among its jockey colony.
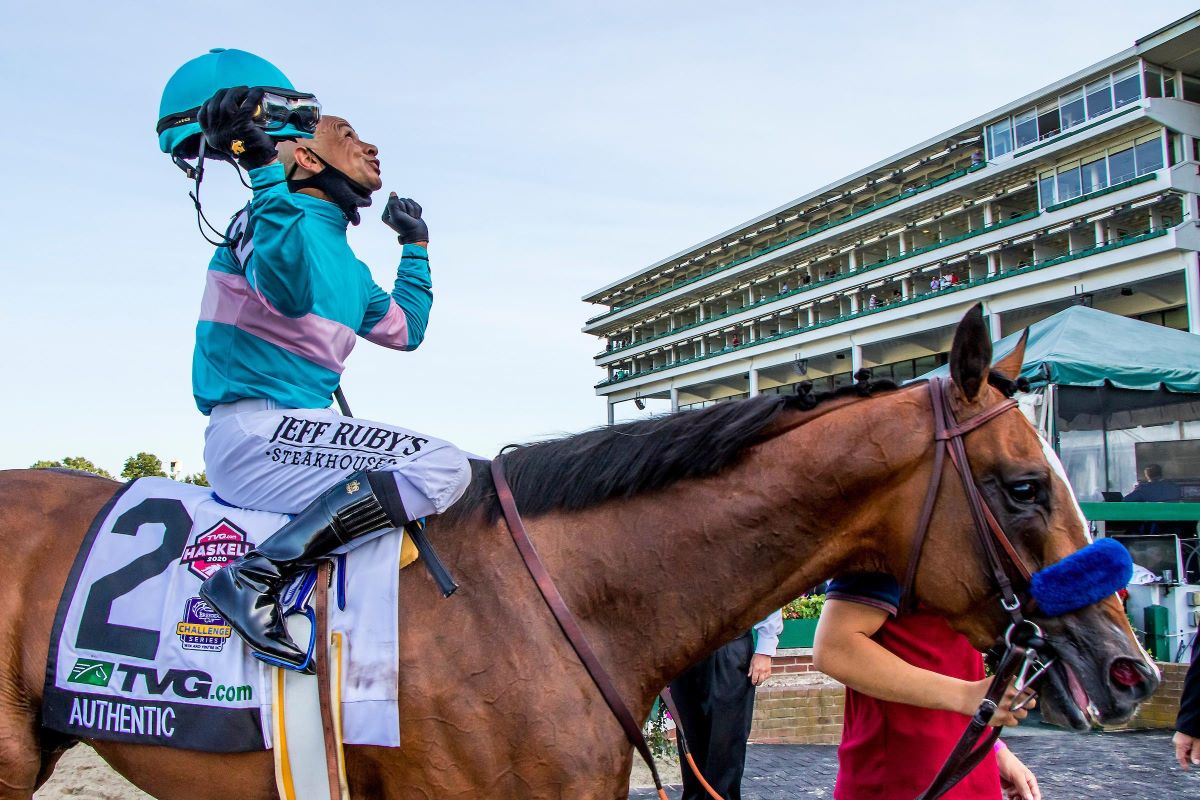
Monmouth Park in New Jersey and Keeneland’s five-day, stakes-packed summer meet, added more handle fuel to the month’s fiery numbers. Monmouth enjoyed a record non-Breeders’ Cup handle day on Haskell weekend of more than $20.4 million.
The biggest takeaway from July’s wagering numbers is that people are betting on horses at tracks up and down the racing food chain – even during a pandemic. Average daily wagering in July spiked 41.8% year-over-year. For the year, average daily wagering is up 41.7%.
Year-to-date, the total 2020 handle fell by 7% to $6,154,466,247. This isn’t bad, considering 2020 race days are down 34.3%, and races held plunged 33%. This indicates that people are using advance deposit wagering (ADW) in greater numbers as they continue finding races to bet.
Derby Day Shines Bright as a Wagering Bonanza
This bodes well for what lies ahead – the Sept. 5 Kentucky Derby – aka, the biggest wagering day of the year. Last year, bettors plunked down $165.5 million on the 2019 Derby and nearly $251 million on Churchill Downs’ Derby Day card. Another $60.2 million went down on the Kentucky Oaks, run the day before the Derby. That race is Sept. 4 this year.
Thoroughbred Economic Indicators — July 2019
| Indicator | July 2020 | July 2019 | % Change |
| Wagering on US Races | $1,098,943,728 | $942,243,633 | +16.63 |
| US Purses | $90,224,084 | $103,342,574 | -12.69% |
| US Race Days | 398 | 484 | -17.77% |
| US Races | 3,280 | 3,742 | -12.35% |
| US Starts | 24,984 | 26,612 | -6.12% |
| Average Field Size | 7.62 | 7.11 | +7.11% |
| Average Wagering Per Race Day | $2,761,165 | $1,946,784 | +41.83% |
| Averages Purses Per Race Day | $226,694 | $213,518 | +6.17% |
Source: Equibase
The monthly decline in purses (12.7%) nearly equaled the decline in races (12.4%). Even with more tracks opening up, starting gates opened 3,280 times at US racetracks in July, down from 3,742 in July 2019.
The rest of the month’s economic numbers reflect racing life in the COVID-19 era: both good and bad. Purses declined once again, dropping 36% for the year to $414,380,742. Much of this reflects casino closures or reduced capacity at “racinos†– casinos attached to racetracks. Much of that income fuels purses, and tracks have adjusted accordingly – often reducing stakes purses to keep overnight races at or near normal levels.
More Cards In July than June — Fewer than Last Year
With more tracks opening up, race cards increased from 300 in June to 398 in July. That said, they still fell 17.7% short of last July’s 484 – reflecting a 17.7% drop.
The flip side of that coin is once again reflected in field size. Despite several high-profile stakes races featuring only four or five horses, average field size went up another 7.1% to 7.62 starters per race. For the year, field size is up 7.7% to a tick under eight horses (7.97) per race.
Equibase normally issues its Economic Indicators in Thoroughbred Racing report quarterly, but is currently issuing them monthly due to the coronavirus pandemic.


