In 1967, a 30-second commercial in the first Super Bowl (then called the AFL-NFL World Championship Game) cost $47,500. With the game’s roaring success, the price went up by $5,000 the next year. Public interest quickly compounded, and by Super Bowl XXIX (1990), the price for 30 seconds of airtime reached $1 million.
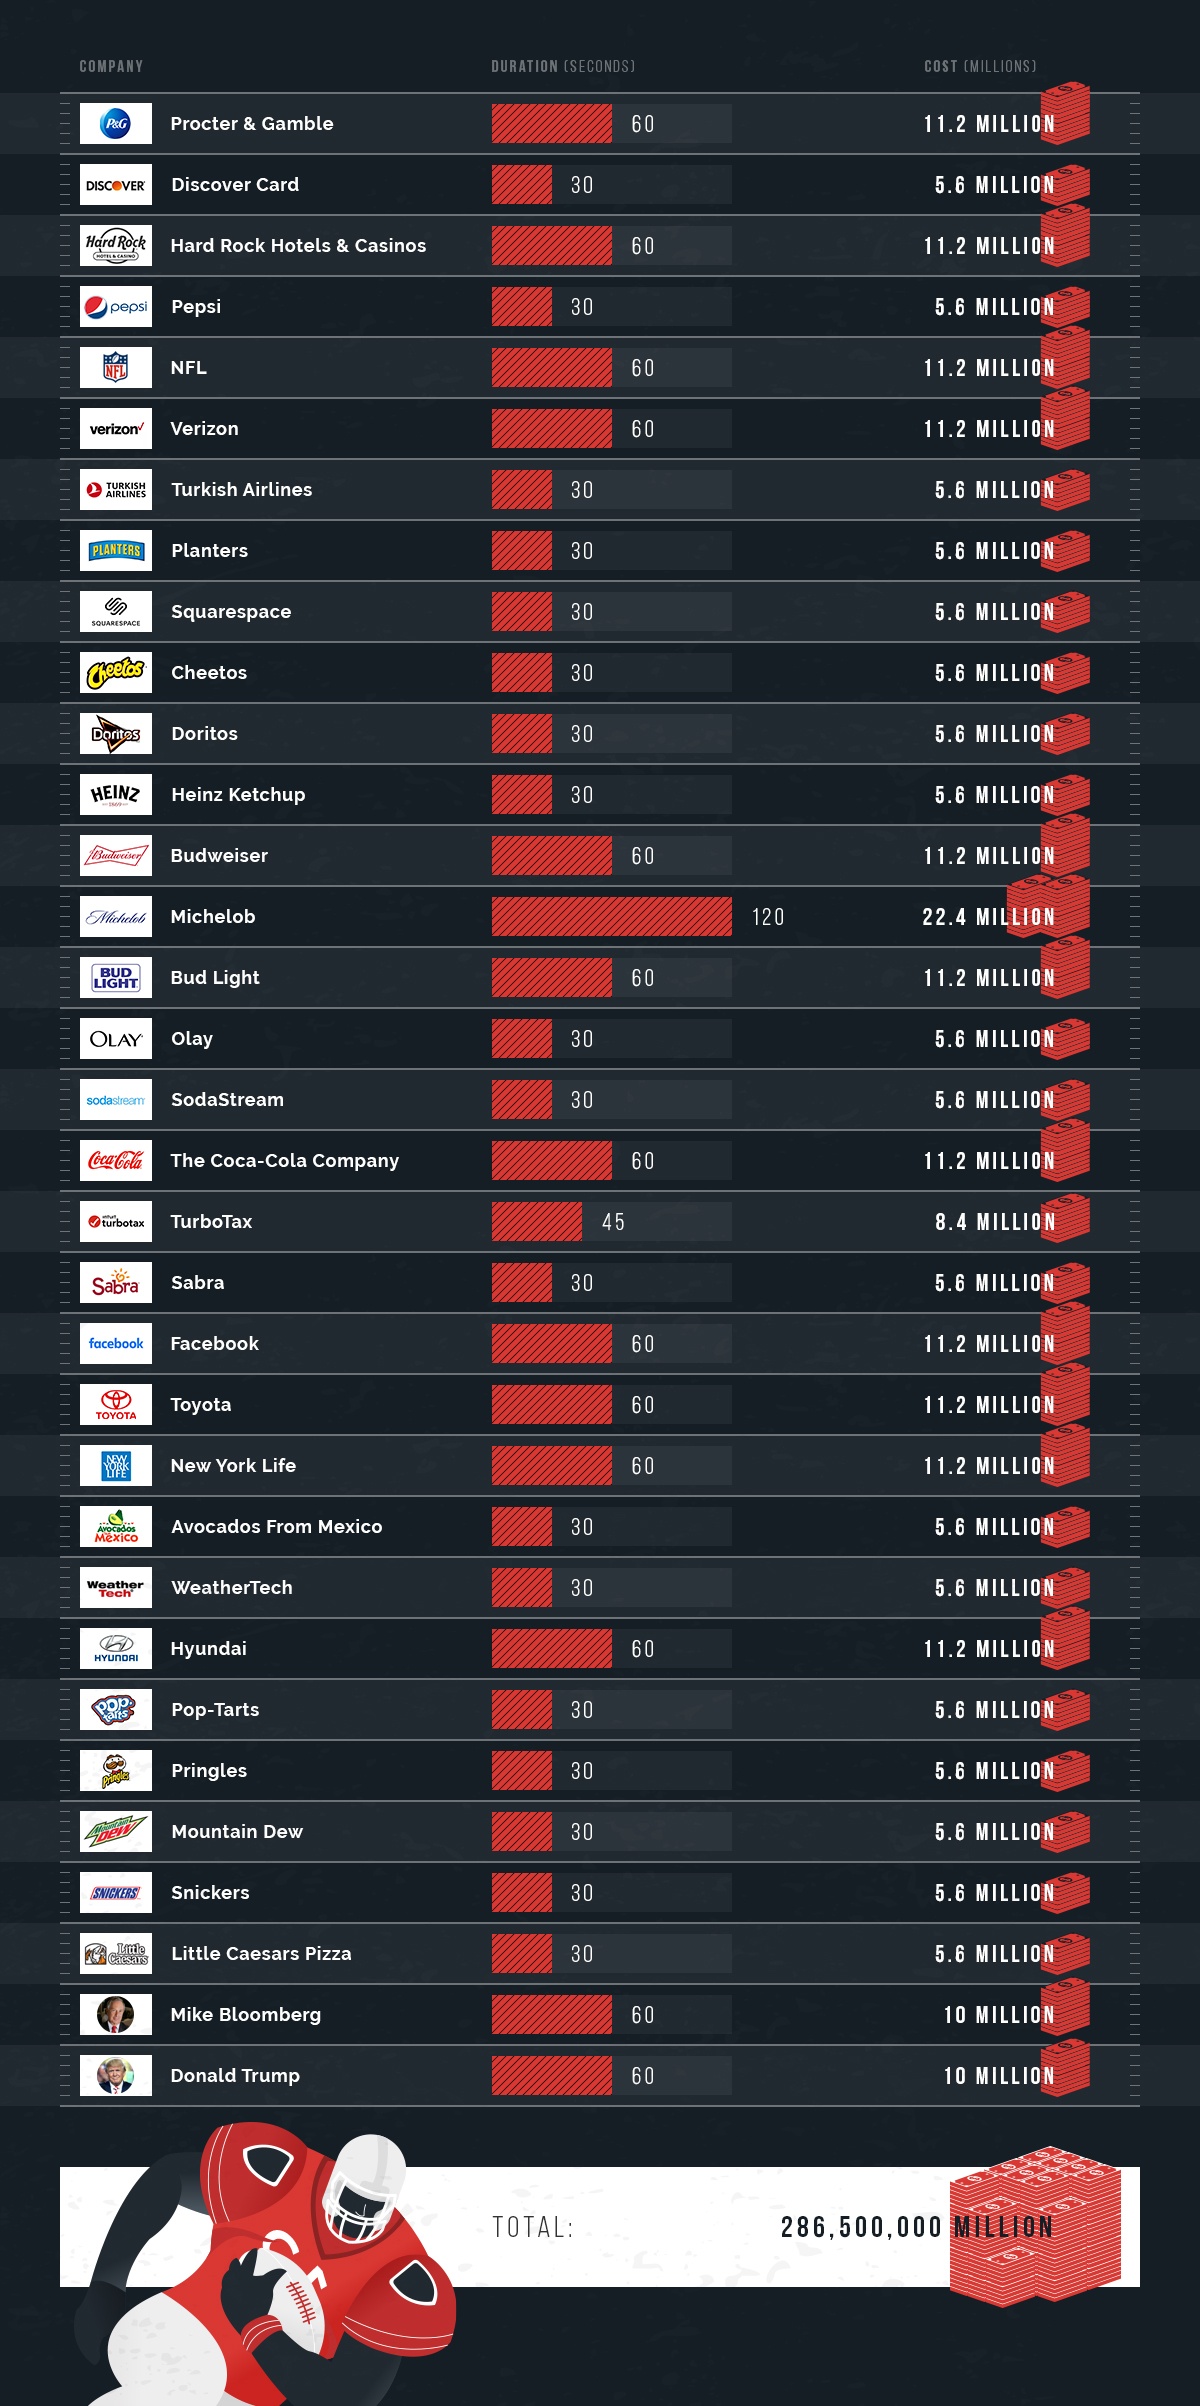
This year, the cost of a 30-second spot is $5.6 million, or $186,667 per second.
Last year’s Super Bowl drew an estimated 112 million viewers in the US from TV and streaming. If the Kansas City Chiefs vs. San Francisco 49ers pulls a similar audience, 2020 Super Bowl advertisers will be reaching roughly 20 people for every dollar spent — significantly less than the 1,200 fans a dollar’s worth of airtime bought in 1967.
Spending Super Bowl Money
Here’s the latest list of Super Bowl advertisers and their estimated spends, based on that $5.6 million retail price:
Super Bowl ads, we know, are more than just commercials — they can become cultural touchstones. Over the years, the Super Bowl introduced us to everyone from the Clydesdales (Super Bowl IX) to Spuds McKenzie (Super Bowl XXI), and a lady who famously barked “Where’s the beef?†(Super Bowl XVIII) — memorable characters that stuck around long after the game, and who still get plays on YouTube.Â
But the escalating cost of Super Bowl advertising has pushed many past advertisers to the sidelines.Â
OG News wanted to know who’s taking the advertising gamble this year — and which industries find it most valuable to spend big money to make their brand an official Super Bowl sponsor.
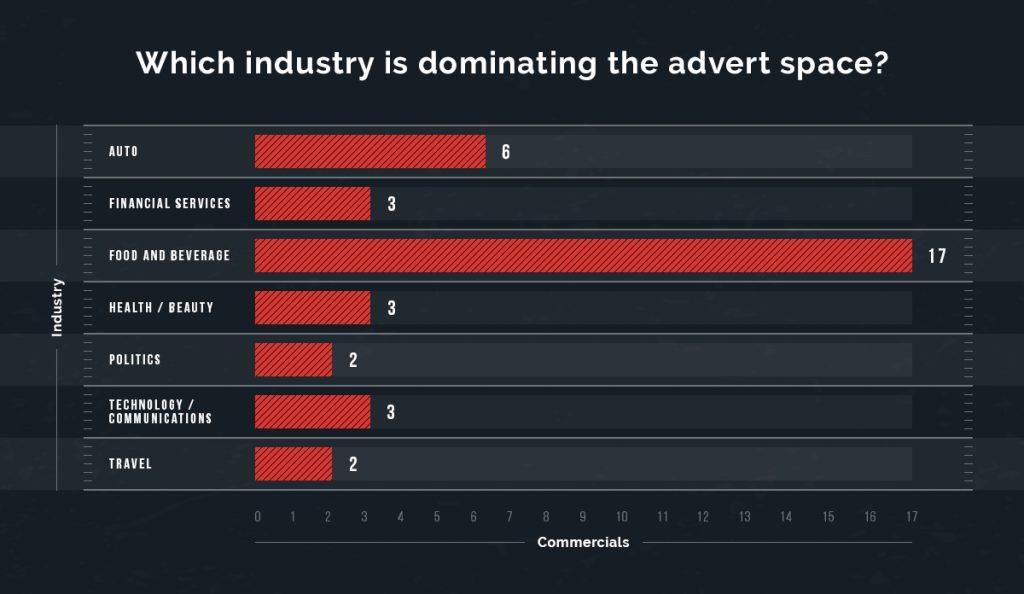
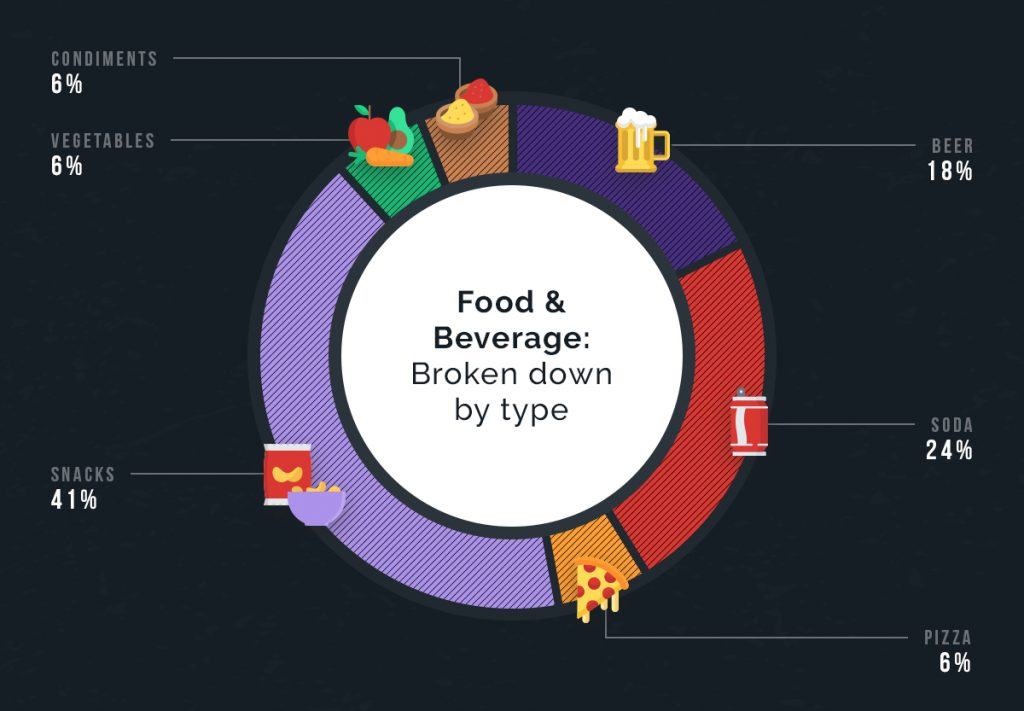
When it comes to total number of Super Bowl ads and the number of seconds they’ll get in front of our eyeballs, the food and beverage industry dominates, followed by automotive. Among the food and beverage advertisers, it’s all about beer, soda, and snacks. (Only one ad for pizza?!)
Complete List of Super Bowl Commercials
Automotive
- Audi
- Hyundai
- Kia
- Porsche
- Toyota
- WeatherTech
Communications
- SquareSpace
- Verizon
Financial Services
- Discover Card
- New York Life
- Turbo Tax
Food and Beverage
- Avocados from Mexico
- Bud Light
- Budweiser
- Cheetos
- Coca-ColaÂ
- Doritos
- Heinz Ketchup
- Little Caesars Pizza
- Michelob
- Mountain Dew
- Pepsi
- Planters
- Pop-Tarts
- Pringles
- Sabra
- Snickers
- SodaStream
Health and Beauty
- Olay
- Procter & Gamble
- Tide
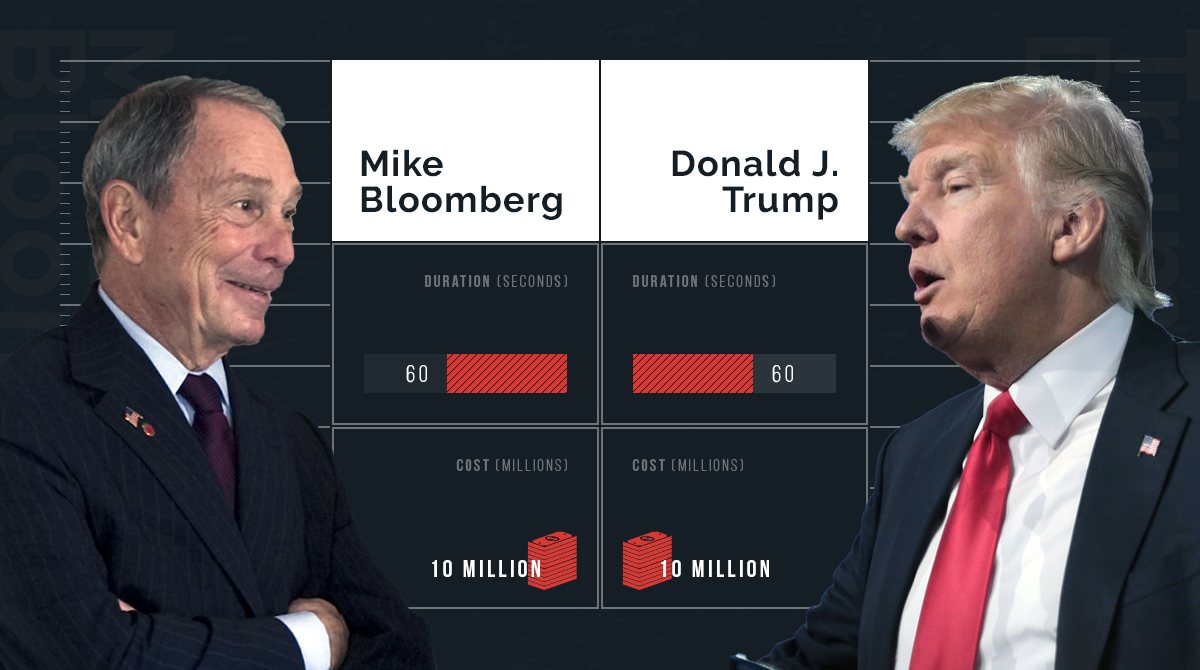
Politics
- Donald J. Trump for President
- Mike Bloomberg 2020
Travel
- Hard Rock Hotels & Casinos
- Turkish Airlines
Not-So-Super Value?
Sure, these commercials get seen in places beyond the Super Bowl Sunday screen — on YouTube, news shows, and websites talking about those news shows. But as time goes on, the size of the television (and now streaming) audience isn’t necessarily keeping pace with the increase in ad price.
If we look at the number of viewers for each Super Bowl, in relation to how much advertisers had to spend, the ROI has quantitatively been dwindling.
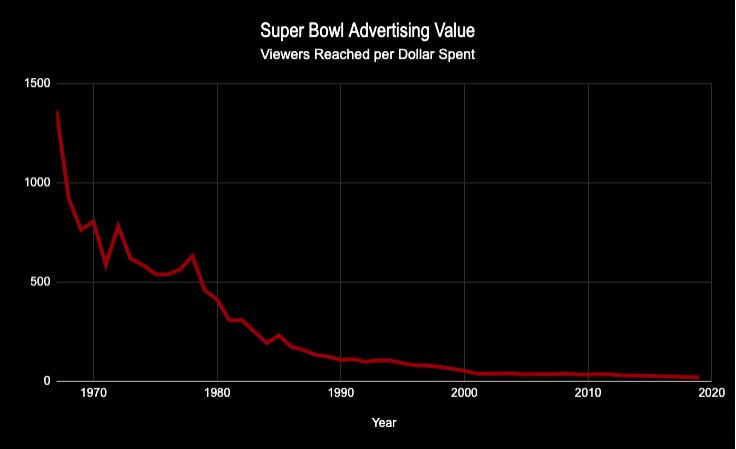
Here’s the running total of Super Bowl advertising costs, seen in comparison with the number of viewers these commercials reach:
| Year | Cost for 30-second spot | Estimated Viewers* | Viewers reached per dollar spent |
| 2020 | $5,600,000 | ?? | ? |
| 2019 | $5,200,000 | 113,270,000 | 22 |
| 2018 | $5,000,000 | 117,953,000 | 24 |
| 2017 | $4,500,000 | 113,690,000 | 25 |
| 2016 | $4,250,000 | 113,732,000 | 27 |
| 2015 | $4,000,000 | 115,781,000 | 29 |
| 2014 | $3,800,000 | 114,110,000 | 30 |
| 2013 | $3,500,000 | 108,700,000 | 31 |
| 2012 | $3,100,000 | 111,346,000 | 36 |
| 2011 | $2,954,010 | 111,010,000 | 38 |
| 2010 | $2,999,960 | 106,476,000 | 35 |
| 2009 | $2,699,963 | 98,732,000 | 37 |
| 2008 | $2,385,365 | 97,448,000 | 41 |
| 2007 | $2,500,000 | 93,184,000 | 37 |
| 2006 | $2,400,000 | 90,745,000 | 38 |
| 2005 | $2,302,200 | 86,072,000 | 37 |
| 2004 | $2,200,000 | 89,795,000 | 41 |
| 2003 | $2,200,000 | 88,637,000 | 40 |
| 2002 | $2,200,000 | 86,801,000 | 39 |
| 2001 | $2,100,000 | 84,335,000 | 40 |
| 2000 | $1,600,000 | 88,465,000 | 55 |
| 1999 | $1,291,100 | 83,720,000 | 65 |
| 1998 | $1,200,000 | 90,000,000 | 75 |
| 1997 | $1,085,000 | 87,870,000 | 81 |
| 1996 | $1,150,000 | 94,080,000 | 82 |
| 1995 | $900,000 | 83,420,000 | 93 |
| 1994 | $850,000 | 90,000,000 | 106 |
| 1993 | $850,000 | 90,990,000 | 107 |
| 1992 | $800,000 | 79,590,000 | 99 |
| 1991 | $700,400 | 79,510,000 | 114 |
| 1990 | $675,000 | 73,852,000 | 109 |
| 1989 | $645,000 | 81,590,000 | 126 |
| 1988 | $600,000 | 80,140,000 | 134 |
| 1987 | $550,000 | 87,190,000 | 159 |
| 1986 | $525,000 | 92,570,000 | 176 |
| 1985 | $368,200 | 85,530,000 | 232 |
| 1984 | $400,000 | 77,620,000 | 194 |
| 1983 | $324,300 | 81,770,000 | 252 |
| 1982 | $275,000 | 85,240,000 | 310 |
| 1981 | $222,000 | 68,290,000 | 308 |
| 1980 | $185,000 | 76,240,000 | 412 |
| 1979 | $162,300 | 74,740,000 | 461 |
| 1978 | $125,000 | 78,940,000 | 632 |
| 1977 | $110,000 | 62,050,000 | 564 |
| 1976 | $107,000 | 57,710,000 | 539 |
| 1975 | $103,500 | 56,050,000 | 542 |
| 1974 | $88,100 | 51,700,000 | 587 |
| 1973 | $86,100 | 53,320,000 | 619 |
| 1972 | $72,500 | 56,640,000 | 781 |
| 1971 | $78,200 | 46,040,000 | 589 |
| 1970 | $55,000 | 44,270,000 | 805 |
| 1969 | $54,500 | 41,660,000 | 764 |
| 1968 | $42,500 | 39,120,000 | 920 |
| 1967 | $37,500 | 51,180,000 | 1,365 |
* Estimated Viewers combines Nielsen ratings for broadcasts in English and Spanish, as well as viewers who watched via streaming services.
Sources:
Sports Media Watch
Ad Age
SuperBowl-ads.com


